

3 Steps to Accessing Dynamic Demographic Insights
Since the beginning of time, or, more accurately, the year 1986, MapInfo Pro has been supporting GIS engineers, business analysts, and other map geeks in their journey to manage, analyze, and visualize location intelligence — then publish it in a way line-of-business users can understand and act on.
Ease-of-use and continuous support are the two key factors that helped MapInfo Pro stand the test of time and evolve. As technology advances, MapInfo Pro improves – providing capabilities to unlock and visualize information, thereby extracting location intelligence more easily. And while the technology is constantly evolving, so does data – the fuel that drives spatial analytics and enables confident decision-making.
Let’s get dynamic
With the introduction of Dynamic Demographics to the Precisely Enrich product portfolio, businesses can now better understand how the population and business opportunities within an area change as people move from one location to another throughout the day.
Traditional demographic data is static – – meaning that businesses lack insight into the, often crucial, reality of daytime population during trading hours. Adding mobile location data transforms demographic data into a dynamic dataset. Seeing the changing profiles and flows of different types of people at a specific location shows how these vary at different moments in time.
With the changes to movement due to COVID-19 and several other socioeconomic factors that emerged after the pandemic, understanding and visualizing how populations move is now more important than ever.
Insights from dynamic population profiles have a huge breadth of applications across many sectors. Uses range from informing site selection of new retail stores or banking branches, to determining how many people are at risk from a natural disaster, and planning more accurate deployment of government services to those that need them most.
With MapInfo Pro v2021, you can visualize, analyze, and output human mobility data insights better and faster, and these quick three steps will help you get started.
Step 1 – Upgrade to the latest version of MapInfo Pro
If you were still on the fence about upgrading to MapInfo Pro v2021, now is the time!
Access to dynamic data is one of many new possibilities that the latest version of MapInfo Pro opens.
With new interface improvements, you can simplify layout design and quickly gain access to dynamic text-labeling tools, time series tool, and more!
Now, you can save tons of time by accessing data in different file formats, such as GeoJSON, GPX, and CSV files, directly from the MapInfo Pro interface, and map the spatial elements in these files in a single process.
Get inspired and discover time-saving tricks by accessing the MapInfo Pro Knowledge Community, and if you feel stuck – reach out to our expert support staff to get trusted advice on implementation, optimization, troubleshooting, and issue resolution.
This upgrade will give you an edge in understanding a location, representing its possibilities, and enabling corporate decision makers to take the type of action that propels business success.
And the best part is – you can try MapInfo Pro v2021 for free! Find out what’s new in the latest release and unlock increased GIS power with a convenient, flexible subscription.
Read our eBook
Human Mobility in an Evolving World
Learn more about how and why human mobility is changing, how Dynamic Demographics can help your organization unlock new insights, and how we protect consumer privacy.
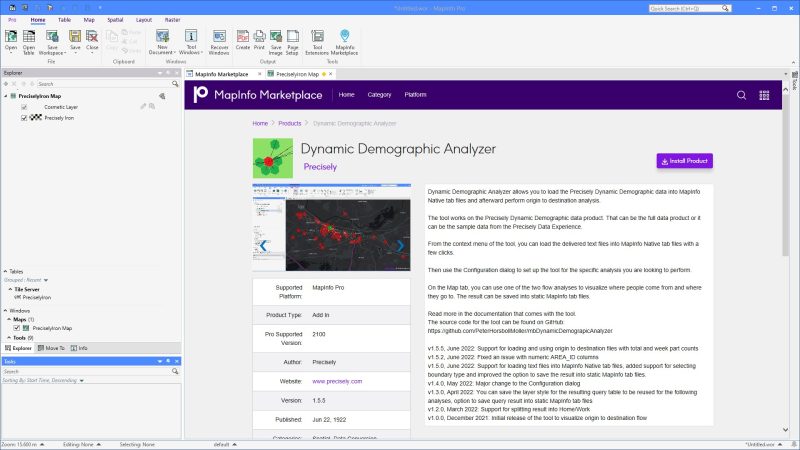
Step 2 – Explore the MapInfo Marketplace
With the MapInfo Marketplace, a collaborative space where users can download and share plugins for the software, you can customize your GIS solution to meet your specific business needs. In this case – you can enhance and accelerate the analysis of dynamic human mobility data.
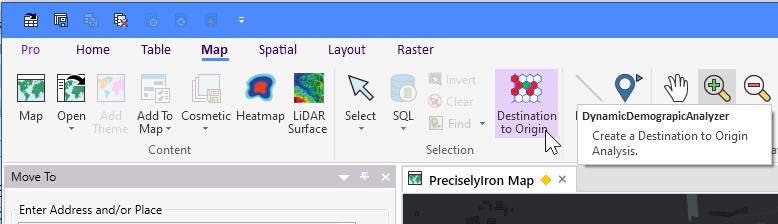
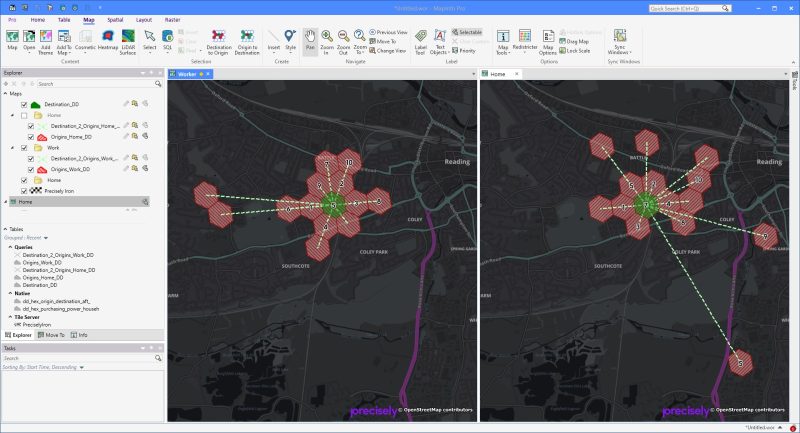
Dynamic Demographic Analyzer tool helps visualize where people come from and where they go, providing insights from dynamic population profiles. Instead of manually creating lines from an origin to a destination, this tool helps automate this process, freeing up lots of time and resources. You can quickly fire up the dynamic data and dive into analysis, as the file conversion is streamlined with this plugin.
Simply put, this is your golden ticket to start using dynamic data to its fullest potential – and it’s free to download and use today!
Step 3 – Unlock the Power of Dynamic Data
You’re all set to unleash the value of human mobility data and enhance your business processes, but don’t have the right data to get a head start? We’ve got you covered.
sample data is available for download (again, for free!) through Precisely Data Experience. Quite frankly, PDX is a real playground for any mapping geek! Addresses, Boundaries, POIs, and Property Features – all these datasets (and more) are available for you to try out.
Now, the way is clear – there is nothing stopping you from fueling your spatial analytics with business-critical human mobility insights. And, if you find any roadblocks on your way – reach out to us through the Knowledge Community – we’re here to help!
MapInfo Pro v2021 makes it easier than ever before to visualize, analyze, and output human mobility data. But don’t take our word for it. Explore MapInfo Pro free for 30 days and stay in the know of upcoming events and product enhancements by joining the MapInfo Pro Knowledge Community.
Read more about Dynamic Demographics, and understand the importance of populations and the way they move.