Precisely Visits
Develop smarter marketing strategies and drive real-world consumer actions, on your own terms
Observe
Observe trends and behaviors of shoppers who visit your locations – and your competitors’
Inform
Find geographical areas with high potential for expansion based on customer loyalty
Analyze
Predict quarterly sales by analyzing store foot traffic patterns and share-of-visit reports
Your way
Customize to fit your needs and resources – regardless of granularity and complexity
Get granular visitation data with Firehose Visits
What are your most pressing needs for visitation data?
Whether for enrichment appends and analytics or activation and measurement, you need by enabling daily delivery of visits data for places across the United States. And with the ability to tune visits by precision and volume, you have the control you need to tackle your unique use cases.
Firehose Visits is the available, delivering ID-level visitation data for all brands within the full Precisely Visits – spanning retail, dining, auto, travel, financial services, and more.
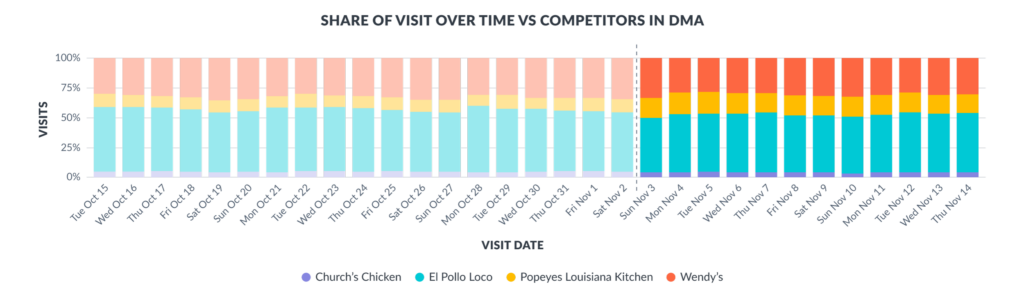
Time-stamped visitation for full Precisely Visits taxonomy
Individual brand location where the visit took place
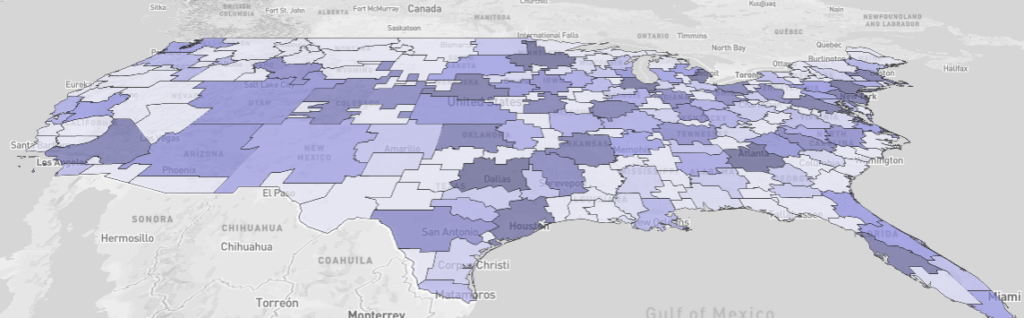
Designated market area, zip code, state, and time zone where the visit occurred
Metadata about the place visited
Conduct powerful analysis with aggregated visit datasets
Precisely Visits provides two aggregated datasets that enable trending, profiling, and trade area analysis:
Daily Visit Counts
Easily ingest visit metrics with the daily visit counts for all brand locations within an entire vertical category.
Place Intelligence Metrics
Build on Daily Visit Counts with this dataset featuring cross-shopping insights, consumer attributes, and trade area details, in addition to trending analysis.
These datasets provide an efficient way for you to directly ingest metrics into your own business intelligence systems. Delivery volumes are significantly easier to manage than Firehose Visits, enabling premium analytic intelligence without processing granular data.
Datasets can also easily be integrated into your own systems to build dashboards and mesh visitation metrics within your business processes.
With complete control and flexibility within your own toolset, you’re able to build views of visitation intelligence to meet your needs.
Understand customers and prospects with Consumer Attributes
Better understanding fuels better results. With our Consumer Attributes dataset, you gain access to demographic, socioeconomic, and geographic attributes by consumer, including:
- demographic attributes
- socioeconomic attributes
- mobile device type
- 90 days of brand visitation
Pre-defined visitation metrics make it easy to connect visitation behaviors and understand who these customers might be.
Consumer Attributes customers can use these datasets to connect to other Precisely Visits datasets or utilize the data for audience profiling and audience activation on third-party data management platforms (DMPs) and demand-side platforms (DSPs).
“With the mindset that consumers need to be at the heart of every marketing strategy, brands and agencies need to find ways to reach them and deliver more relevant messages. We believe quality data and advanced technology underpin that entire approach, and our collaboration and investment with Precisely Visits reinforce our commitment to helping brands meet that expectation.”
Boost intelligence with turn-key analytic dashboards
Join major brands that use our location dashboards to understand consumer movement, monitor competitors, and measure market performance.
Backed by Daily Visit Counts and Place Intelligence Metrics datasets, you can easily uncover valuable insights about your brand (and your competitors) through packaged foot traffic analytics.
Dashboard views include visitation trends by day and hour, consumer demographic profiles, cross-shopping behaviors, trade area analysis, and more.
Audience intelligence
Elevate your marketing and business strategies by understanding your audience’s movement story
Competitive intelligence
Edge out competitors with a deep analysis of your share-of-visit performance – by DMA or audience type
Market intelligence
Stay ahead of market shifts by analyzing industry-specific gains and losses when it comes to store visitation patterns
Traffic Health and Metrics Dashboards
Share of Visit
Use the Traffic Health Dashboard to understand the impact of events and promotions on your competitive share of market.
Below, we see that Popeyes’ Share of Visit increases significantly after the re-launch of the famed Popeyes chicken sandwich on Nov 3rd.
Regional
Use the Place Intelligence Metrics Dashboard to understand where your locations are thriving regionally.
Looking at Ford, we can determine they capture the highest visit share in the Midwest, Central, and Southern regions of the US.
Foot Traffic
Use the Traffic Health Dashboard to monitor spikes and changes in daily foot traffic.
In this example, Macy’s and Nordstrom have won traffic per store on Black Friday. Costco is revealed as a strong competitor throughout December, but doesn’t have the same Black Friday boost as other brands.
Go Further
To enrich your data even further, explore how the Data Graph API provides seamless access to curated datasets through a single query, enabling powerful, flexible enrichment.
Then, discover how Data Link connects Precisely’s portfolio with trusted partner data to simplify integration and unlock even more valuable insights.
Data Link brings market-leading data provider partners together so you can rapidly discover, connect, and use the data you need most for analytics and operations.