
As a wise man once said, the only constant is change. This may have never been truer than it is today. Where we go and when, is changing globally and locally, at different speeds. It is a concerning time for those of us that rely on a physical presence to drive business or for our income. Footfall patterns have changed dramatically leaving a sense of confusion. Understanding these spatial relationships can help inform business decisions.
- Will these changes last?
- Where exactly have things changed?
- How frequently are they changing?
- What are the new patterns?
- And most importantly, how can I keep up with these changes?
As McKinsey reports, businesses have now been pushed over a technology tipping point. Tech adoption is now years ahead of previous predictions.
Understanding change
We see what has happened in our local area as we move about in a new normal, but how do we scale this across an entire retail network or potential new market? Whether local, international, or global, the individuality of a site will drive a different picture at every location.
Once we discover change and understand the spatial relationships that may influence it, how do we quantify and evidence it? Precisely provides both the data and the tools to do so. Let’s investigate.
Read the Forbes Insights white paper
Location Intelligence: The Data-Driven Paradigm Shift
Learn how to use location data more effectively and transition from collecting location coordinates to achieving location intelligence.
Large central destinations
All cities have suffered during the COVID-19 global pandemic, but at different rates. Some city centres were hit harder and took longer to bounce back, others found footfall returned more quickly but with changes in activity location. Secondary lockdown numbers in the UK varied considerably from the first but overall a consistent negative effect was felt in large central destinations.
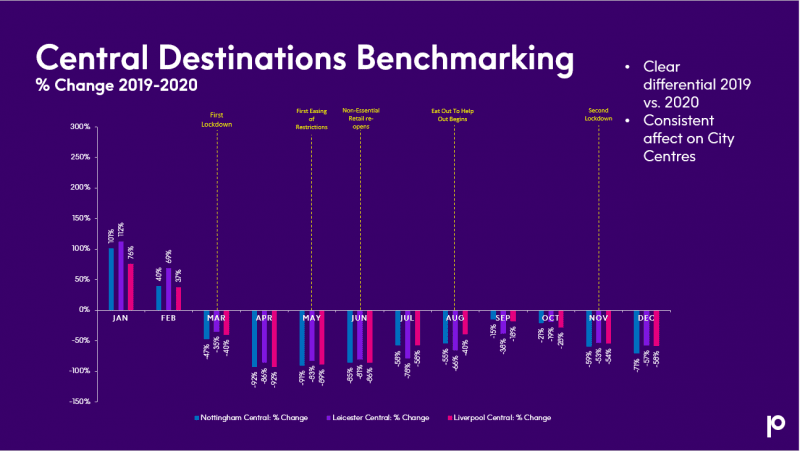
Central destinations all dipped into negative average footfall and improved to varying degrees as restrictions were lifted and during the second lockdown.
Local destinations
All local destinations have been affected, but it’s clear to see, all at very different levels. Why have some locations returned to pre-pandemic levels whilst other are still struggling? We can see that Liverpool Old Swan returned to the same levels of footfall in December 2020 as it had in January 2020. This location bucked the trend and was not the only one. Whilst other locations were in in negative average footfall, this location was positive. What do these trends, patterns, and spatial relationships mean to your business? The power of this insight can inform how you may reconfigure your business to maximize the changing situation.
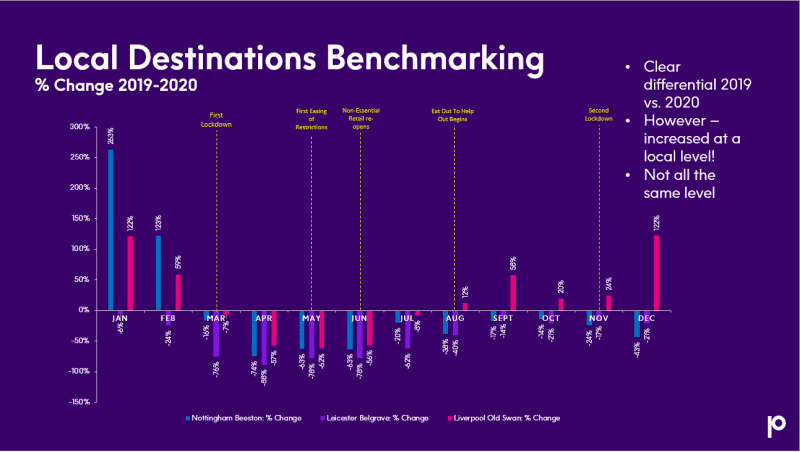
Evidencing outliers in footfall shows just how different things can be location to location, understanding why is the key to success.
Change in footfall can be measured at a macro level to determine the nuisances in local activity that are critical for success. Understanding percentage change at your locations over time can aid strategy, determine if you need to stay put, relocate, or reconfigure your business.
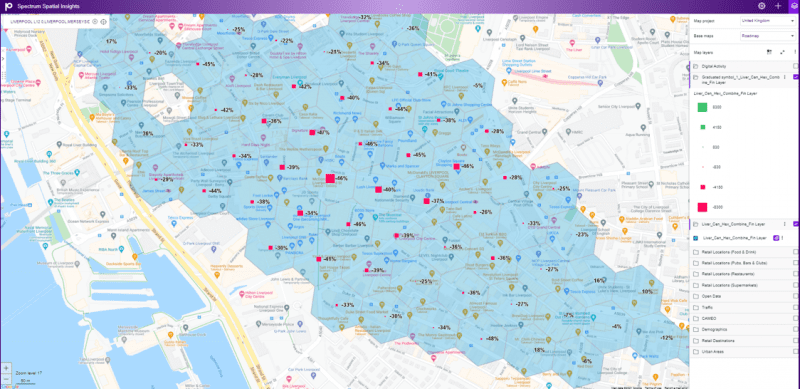
The red locations identify the negative change in footfall at every location across the city.
Footfall and consumer profiles?
As we transition together into a new way of working, living, pursuing leisure interests and purchasing, many of us have found new locations locally that we had not taken advantage of. Many of us have found the joy in what’s local and have formed new patterns of movement. Some we will retire when things return to normal, some we will keep.
As a result, the obvious locations are no longer quite so obvious, and the profile of people who are frequenting these locations has changed.
With frequent updates and enrichment of footfall with demographic information and consumer profiles, we shed light on the spatial relationships and the changes that have occurred. For example, where footfall has increased, when it has increased and for how long, and importantly the consumer profile that frequents those locations and time slots.
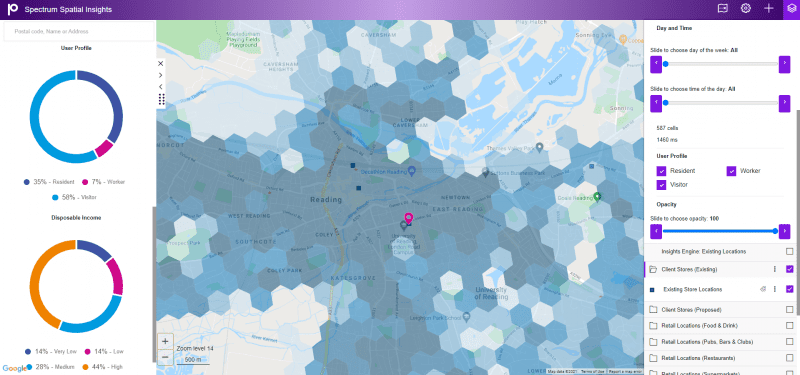
Identifying high footfall areas at specific times with the right customer profile is essential.
Absolute attention is required regarding Data Integrity alongside Security and Privacy ensuring that not only are you compliant but ensuring data trends, patterns, and results are representative of the real world. This is where Precisely prides ourselves in being the best. Software and data can only do so much, precision and accuracy come from experience and due diligence of data sources and methodologies.
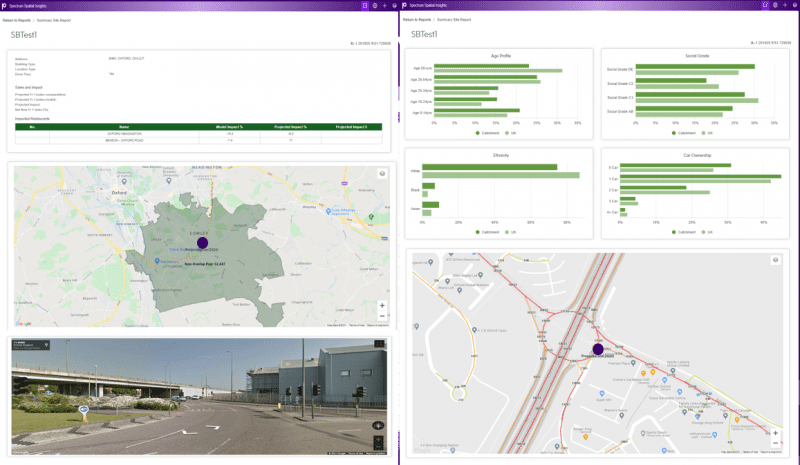
Intuitive and comprehensive report building reduces the need to use multiple different applications to get the job done. It also provides a single source of truth.
We are consistently helping our clients in retail, banking, advertising, and telecommunications navigate a changing world and protecting their investments by providing them with precise and accurate data-driven decision making.
To learn how organizations can begin to use location data more effectively and transition from collecting location coordinates to achieving location intelligence, read this Forbes Insights white paper Location Intelligence: The Data-Driven Paradigm Shift.