

Whether you’re a data scientist, machine learning engineer, or software engineer working in Spark, knowing the basics of application profiling is a must. But profiling Spark applications is challenging, particularly if you’re new to Spark or distributed frameworks. Have no worries, though, because even if you’ve never thought about profiling before, this blog post will equip you to profile your own applications. By the end of the post, you’ll have a basic understanding of:
- What application profiling is and why it’s important.
- Native profiling tools in Spark and their limitations.
- What sparkMeasure is, why you should use it over the native profiling tools, and how to use it.
What is application profiling?
Application profiling refers to the process of measuring application performance. Performance is measured through a variety of workload metrics: run time, CPU time, utilized memory, I/O file sizes, I/O read/write time, and many more. The goal of profiling is typically to identify ways to decrease the run time of your application. However, profiling can also be performed with the goal of optimizing resource utilization (e.g. same run time but with fewer resources) or detecting performance issues in production environments (e.g. this application used to take 1 hour to run but now it’s taking 2 hours, what gives?).
Here at PlaceIQ, application profiling is important due to the fact that we’re a big data company with significant compute requirements (>1000 TB hours per day for memory). As the business grows and more products are released or we acquire more location data, the amount of resources consumed by our Spark jobs can quickly explode. We use profiling to identify jobs that are disproportionately hogging resources, diagnose bottlenecks in those jobs, and design optimized code that reduces the load on our computing cluster.
Anatomy of a Spark application
Before diving into profiling Spark applications, we need to understand the anatomy of a Spark application. Every computation in Spark is divided in small parts called jobs, stages, and tasks. Jobs consist of one or more stages and stages consist of one or more tasks. Every time you execute an action in Spark (.show, .collect, .write, etc.), a job is created. Stages within that job define sections of code that require no repartitioning (i.e. redistribution of data, commonly referred to as a shuffle). For example, reading a file from disk and then applying .map or .filter can be done without a shuffle and hence would be contained in a single stage. Instead, reading two files and joining them together will likely require a shuffle and hence multiple stages. Tasks within those stages define transformations that occur on a single partition of data. For example, if you read a file from disk that is contained on two partitions and you perform a .map operation, two tasks, one for each partition, will be created. Tasks are the most granular level of computation in Spark. Executors are individual worker nodes that are in charge of executing tasks.
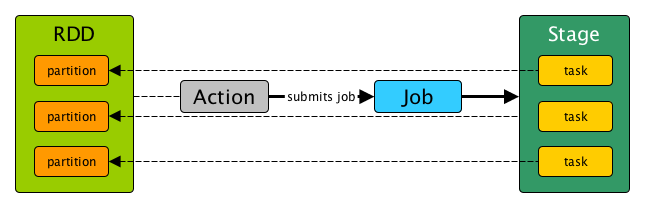
Figure 1. Anatomy of Spark application: relationship between data (RDD, DataFrame, Dataset, or otherwise), actions, job, stages, and tasks. Taken from https://books.japila.pl/apache-spark-internals/scheduler/Stage/
Product Information
PlaceIQ Movement
Develop smarter marketing strategies and drive real-world consumer actions by using PlaceIQ’s proprietary visitation data to analyze consumer movement, on your own terms.
Spark profiling basics
Most performance profiling in Spark is done with the intention of discovering which parts of your application consume a disproportionate amount of time or resources. For this reason, the two questions you’re usually trying to answer when profiling Spark application are:
- Which jobs/stages are taking the longest?
- What are the bottlenecks in those stages (I/O, CPU, memory?)
To answer these questions, we need tools that can measure workload metrics (run time, CPU time, etc.) for each task, aggregated across all tasks at the stage-level, and aggregated across all tasks at the job-level. Typically, you start by pinpointing the jobs that are taking the longest, then pinpointing the stages that are taking the longest within those jobs, and finally trying to understand the bottlenecks in those stages. Some common origins of bottlenecks include:
- Large shuffles:usually from large join or groupBy statements. It takes time for the network to transfer data between the nodes and, if executor memory is insufficient, big shuffles cause shuffle spill (executors must temporarily write the data to disk, which takes a lot of time)
- Task/partition skew:a few tasks in a stage are taking much longer than the rest. This usually occurs because some data partitions are much larger than the rest (commonly referred to as skew)
- High garbage collection:occurs when there’s not enough heap memory
However, every job is unique and there are many different causes of bottlenecks. In order to keep the scope of this blog post focused, I’m going to avoid talking about these details and focus on getting you set up with the tools to be able to profile your own applications.
Native profiling tools in Spark
The Resource Manager (re: Web UI) is pretty much the only native profiling tool that Apache provides for Spark. I say “pretty much” because there are actually two other native tools, the event logs and a configurable metrics system (see https://spark.apache.org/docs/latest/monitoring.html#executor-task-metrics), but setting up and accessing these systems is not trivial. Furthermore, these systems provide similar metrics as the Resource Manager, so there’s not much benefit in using them. This is especially true when considering easier-to-use external profiling tools like sparkMeasure, which I’ll talk about in the next section. With that said, I’ll focus on describing the Resource Manager as well as it’s pros and cons for the rest of this section.
The Resource Manager exposes task-level performance metrics like execution time, execution memory, shuffle size, garbage collection time, etc. It also aggregates some of those performance metrics at the stage and job-levels. The big selling point of the Resource Manager, in my opinion, is it’s ease of use. Every SparkContext launches a Resource Manager – no extra work is required. You can access it at port 4040 of the driver node (https://your-driver-node:4040).
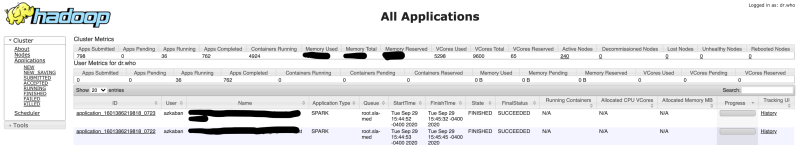
Figure 2. Resource manager layout
To look at the performance metrics for a job, click the “ApplicationMaster” button for your application in the Resource Manager. This first page tells you how many jobs are active/completed, how many stages are in each job, and the duration of each job. Clicking an individual job will send you to a page that has stage-level information: how many tasks are in each stage, how many tasks are completed, as well as several stage-level performance metrics like duration, input size, output size, shuffle read size, etc. Finally, clicking an individual stage will send you to a page that contains task-level metrics. You can scroll through the performance metrics for each task under the section labeled “Tasks” or look at the summary metrics near the top of the page.
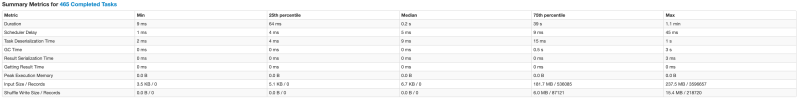
Figure 3. Task-level metrics summary in the Resource Manager for a single stage.
Unfortunately, the Resource Manager has some limitations:
- Aggregated performance metrics are lacking: my typical workflow for profiling starts with identifying bottleneck jobs and stages but the Resource Manager only exposes a few metrics aggregated at the job and stage-levels. Sometimes, these aren’t enough to get the job done.
- Metrics cannot be saved easily for later consumption: there’s no way to save/export performance metrics for a given application and once the application is terminated, the performance metrics are gone forever. This makes it challenging to compare performance between iterations of code or over time. Note that performance metrics can be saved if you use the event logs or the configurable metrics system mentioned above.
- Difficult to isolate pieces of code when working in a notebook environment: this one hits close to home as someone who utilizes Spark in Apache Zeppelin rather than in an IDE environment. Even identifying which jobs belong to a block of code I just ran can be unreasonably difficult. Ideally, there should be a way to easily isolate and measure pieces of code.
SparkMeasure: profiling made easy
SparkMeasure is a tool developed by Luca Canali (https://github.com/LucaCanali/sparkMeasure) that “simplifies the measurement and troubleshooting of Spark workloads.” SparkMeasure essentially takes all of the information available to you in the Resource Manager and stores it in a Spark DataFrame. Depending on how you use sparkMeasure, the DataFrame might contain performance metrics for each task, for each stage, or aggregated over all tasks/stages. That’s it. It’s incredibly simple and yet surprisingly useful. With the data organized neatly in DataFrames and available at different levels of aggregation, I find it much easier to answer the key profiling questions I mentioned before.
You can use SparkMeasure interactively (in other words, you can use it to collect and analyze workload metrics as you work in your spark shell / Zeppelin notebook) or you can instrument your application with it, save performance metrics as your application runs, and analyze the results after execution. As you’ll see in the next section, sparkMeasure’s API makes it simple to isolate and measure the performance of individual code blocks, though some care needs to be taken because of lazy evaluation in Spark (remember, only actions create jobs in Spark, so only actions can be measured).
How to use sparkMeasure
The installation process for sparkMeasure is easy. If you’re using a spark shell, add the following code when you launch your spark shell:
–packages ch.cern.sparkmeasure:spark-measure_2.12:0.16
e.g. bin/spark-shell –packages ch.cern.sparkmeasure:spark-measure_2.12:0.16
If you’re using pyspark, you’ll need to install sparkMeasure before running your spark shell:
pip install sparkmeasure
If instead you’re using Zeppelin, add the following under `spark.jars.packages`:
ch.cern.sparkmeasure:spark-measure_2.12:0.16
Note that the above code is for an older version of sparkMeasure compatible with Scala 2.12. The most up-to-date version of sparkMeasure is
ch.cern.sparkmeasure:spark-measure_2.12:0.17 for Scala 2.12 and
ch.cern.sparkmeasure:spark-measure_2.11:0.17 for Scala 2.11.
You can check your version of Scala with the command util.Properties.versionString. Once installed, you can use sparkMeasure to collect performance metrics at either the stage or task level in the following way:
// Stage Metrics
val stageMetrics = ch.cern.sparkmeasure.StageMetrics(spark) // initialize sparkMeasure
stageMetrics.runAndMeasure{ code_to_run } // profile application
val profileByStage = stageMetrics.createStageMetricsDF("PerfStageMetrics")
val profileAggdStages = stageMetrics.aggregateStageMetrics("PerfStageMetrics")

// Task Metrics
val taskMetrics = ch.cern.sparkmeasure.TaskMetrics(spark) // initialize sparkMeasure
taskMetrics.runAndMeasure{ code_to_run } // profile application
val profileByTask = taskMetrics.createTaskMetricsDF("PerfTaskMetrics")
val profileAggdTasks = taskMetrics.aggregateTaskMetrics("PerfTaskMetrics")
The variable code_to_run can be as small as a single line of code or as large as a full application. The variables profileByStage and profileByTask contain metrics for every stage and task, respectively, and the variables profileAggdStages and profileAggdTasks contain the aggregated sum of those metrics over all stages and tasks, respectively. Note that there is a larger overhead associated with profiling task-level metrics, so only use those when absolutely necessary.
Instead of showing the schemas for each DataFrame here, I’ll just show the schema for profileByStage to give you a good idea of the metrics that are reported.
root
 |-- jobId: integer (nullable = false)
 |-- jobGroup: string (nullable = true)
 |-- stageId: integer (nullable = false)
 |-- name: string (nullable = true)
 |-- submissionTime: long (nullable = false)
 |-- completionTime: long (nullable = false)
 |-- stageDuration: long (nullable = false)
 |-- numTasks: integer (nullable = false)
 |-- executorRunTime: long (nullable = false)
 |-- executorCpuTime: long (nullable = false)
 |-- executorDeserializeTime: long (nullable = false)
 |-- executorDeserializeCpuTime: long (nullable = false)
 |-- resultSerializationTime: long (nullable = false)
 |-- jvmGCTime: long (nullable = false)
 |-- resultSize: long (nullable = false)
 |-- numUpdatedBlockStatuses: integer (nullable = false)
 |-- diskBytesSpilled: long (nullable = false)
 |-- memoryBytesSpilled: long (nullable = false)
 |-- peakExecutionMemory: long (nullable = false)
 |-- recordsRead: long (nullable = false)
 |-- bytesRead: long (nullable = false)
 |-- recordsWritten: long (nullable = false)
 |-- bytesWritten: long (nullable = false)
 |-- shuffleFetchWaitTime: long (nullable = false)
 |-- shuffleTotalBytesRead: long (nullable = false)
 |-- shuffleTotalBlocksFetched: long (nullable = false)
 |-- shuffleLocalBlocksFetched: long (nullable = false)
 |-- shuffleRemoteBlocksFetched: long (nullable = false)
 |-- shuffleWriteTime: long (nullable = false)
 |-- shuffleBytesWritten: long (nullable = false)
 |-- shuffleRecordsWritten: long (nullable = false)
Example measurements
1) Interactive usage
In my opinion, sparkMeasure shines most when it’s used interactively for simple, one-off measurements. For example, I was recently working on a project where the following question came up: “if you have a DataFrame saved in parquet format and you read that DataFrame but select a subset of the columns, does Spark read the entire dataset and then filter out the unnecessary columns or does it only read the relevant part of the dataset?” Let’s figure out the answer by using sparkMeasure.
I’ll read a sample dataset at PlaceIQ and analyze the number of bytes read with and without selecting a subset of the columns. The dataset has two columns: a and b. First, I’ll measure the number of bytes read when displaying the first 100 rows with both columns:
val stageMetrics = ch.cern.sparkmeasure.StageMetrics(spark)
val dataframe = spark.read.parquet("/path/to/dataframe")

stageMetrics.runAndMeasure{ dataframe.limit(100).show }
val profile_without_select = stageMetrics.aggregateStageMetrics("PerfStageMetrics")
The number of bytes read is:
sum(bytesRead) => 13070778 (12.0 MB)
Now we measure the number of bytes read for reading and displaying the first 100 rows but only with column a:
stageMetrics.runAndMeasure{ dataframe.select($"a").limit(100).show }
val profile_with_select = stageMetrics.aggregateStageMetrics("PerfStageMetrics")
The number of bytes read is:
sum(bytesRead) => 534189 (521.0 KB)
The select statement reduces the number of bytes read by about 95%. See how easy that was? Cool! Although this question could also be answered using the Resource Manager, sparkMeasure’s API makes it much more simple.
2) Instrumenting your code
SparkMeasure is also great when used non-interactively to instrument parts of your code. For example, in a recent project of mine I wrote a class that executed three distinct steps and used sparkMeasure to measure the resources each step was consuming:
case class MyClass(dt: String)(implicit val spark: SparkSession) {
  import spark.implicits._

  def Step1 = {...} // details not important
  def Step2 = {...} // details not important
  def Step3 = {...} // details not important

  val stageMetrics = ch.cern.sparkmeasure.StageMetrics(spark)
  def execute = {
    stageMetrics.runAndMeasure{Step1}
    val step1_profileByStage=stageMetrics.createStageMetricsDF("PerfStageMetrics")
    stageMetrics.saveDF(step1_profileByStage, s"/path/to/output/dt=$dt")
    val step1_profileAggdStages=stageMetrics.aggregateStageMetrics("PerfStageMetrics")
    stageMetrics.saveDF(step1_profileAggdStages, s"/path/to/output/dt=$dt")

    stageMetrics.runAndMeasure{Step2}
    val step2_profileByStage=stageMetrics.createStageMetricsDF("PerfStageMetrics")
    stageMetrics.saveDF(step2_profileByStage, s"/path/to/output/dt=$dt")
    val step2_profileAggdStages=stageMetrics.aggregateStageMetrics("PerfStageMetrics")
    stageMetrics.saveDF(step2_profileAggdStages, s"/path/to/output/dt=$dt")

    stageMetrics.runAndMeasure{Step3}
    val step3_profileByStage=stageMetrics.createStageMetricsDF("PerfStageMetrics")
    stageMetrics.saveDF(step3_profileByStage, s"/path/to/output/dt=$dt")
    val step3_profileAggdStages=stageMetrics.aggregateStageMetrics("PerfStageMetrics")
    stageMetrics.saveDF(step3_profileAggdStages, s"/path/to/output/dt=$dt")
  }
}
Every time this class runs the execute method, it runs all three steps and measures them. By instrumenting my code in this way, I could easily monitor how the amount of resources each step consumes changes for different inputs or over time.
Let’s look at some key takeaways from the profiles that were saved.
- All steps are CPU bound (i.e. limited by CPU). You can see this by looking at the ratio between executorCpuTime and executorRunTime. A value close to 1 implies the performance is CPU bound. Any difference between executorCpuTime and executorRunTime is attributable to things like I/O time, garbage collection time, shuffle wait time, etc.
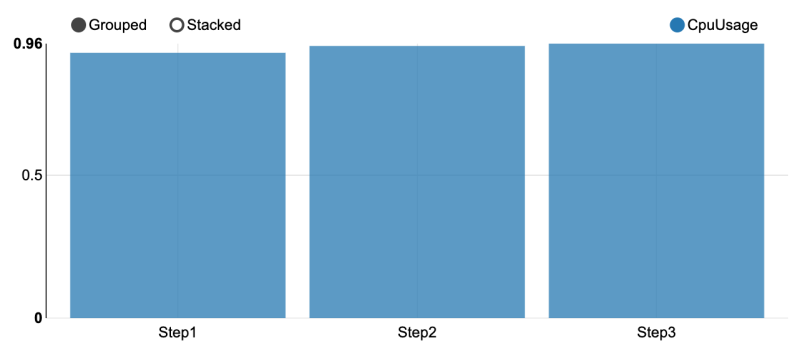
Figure 4. Ratio of executorCpuTime and executorRunTime for the three steps.
- Step 2 and 3 are taking ~80% of the total executorRunTime. Although not shown, these steps also take ~80% of the duration (real world clock time).
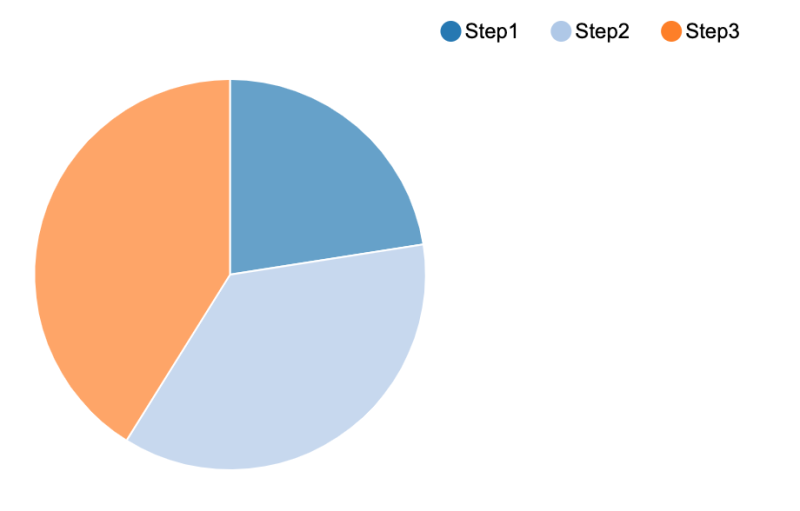
Figure 5. ExecutorRunTime for the three steps.
- While all steps involve large shuffles (> TB), the shuffles are causing large spills in step 2 and step 3.
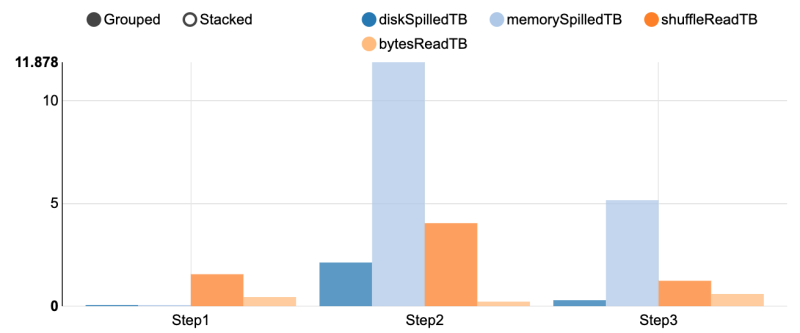
Figure 6. Shuffle memory and data spill for the three steps.
With this knowledge, we can say that steps 2 and 3 are the current bottlenecks and that the bottlenecks are related to large shuffling and subsequent spilling. Optimizing these steps likely includes diagnosing if there is skew in our shuffle partitions as well as increasing the amount of executor memory. I won’t actually optimize the steps in this blog post, but hopefully the example shows you how you can use sparkMeasure to assess your application’s performance and diagnose potential issues.
Final thoughts
SparkMeasure is a nifty tool that takes away some of the pain of profiling applications in Spark. Visit these links if you want more information about what sparkMeasure is capable of or how to interpret sparkMeasure results:
- https://github.com/LucaCanali/sparkMeasure
- https://db-blog.web.cern.ch/blog/luca-canali/2017-09-performance-analysis-cpu-intensive-workload-apache-spark
- https://db-blog.web.cern.ch/blog/luca-canali/2017-03-measuring-apache-spark-workload-metrics-performance-troubleshooting
Also, note that there are other options than sparkMeasure! While writing this blog post, I found that Uber recently developed a JVM profiler that can be used with Spark: https://eng.uber.com/jvm-profiler/. There’s also a JVM profiler developed by Etsy: https://github.com/DataDog/spark-jvm-profiler. I haven’t had time to try these out myself but they seem great.
Develop smarter marketing strategies and drive real-world consumer actions by using and proprietary visitation data to analyze consumer movement, on your own terms. Read more about our product PlaceIQ Movement.