

The discipline of managing Geographic Information Systems (GIS) has evolved over the past two decades. The exponential growth in our ability to generate, capture, and analyze data has fueled a revolution in the way both civil and commercial entities make decisions. GIS has grown away from its cartographic roots and modernized into the application of location to any and all types of data.
This growth has pushed GIS out from the basement server rooms of large companies and into the forefront of the business decision making process. All of a sudden, the folks who were happily making maps are now responsible for normalizing and analyzing data across multiple areas of the business to drive revenue and reduce costs. The applications of location to business processes are limitless, touching everything from forecasting, reporting, site selection, service offerings, risk management, logistics, and more. With all of these changes, let’s take a quick look at the basis of GIS and try to redefine it within the context of the modern age of data integrity.
GIS, in a nutshell, involves bringing together different data that exists over a specific geographic location to derive information from the correlation of the different datasets as they relate to that location. This basic concept hasn’t changed. What has changed is the amount and types of data out there, the architectural options available for designing local, cloud-hosted, or hybrid solutions, and the proliferation of GIS data within industries and the effect it has on the user experience.
The great data flood
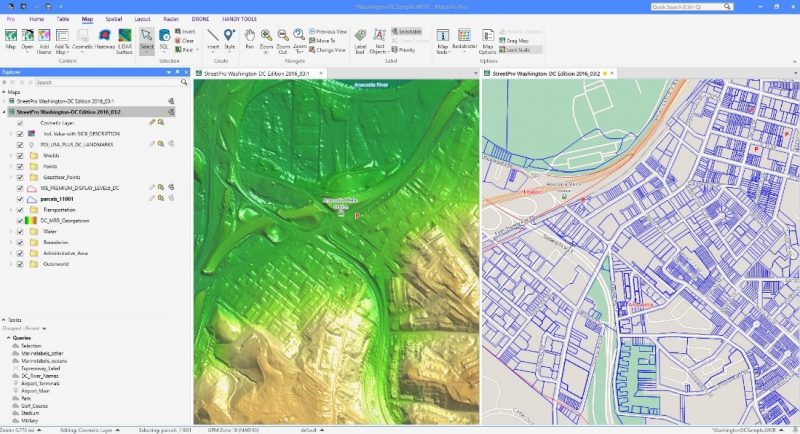
One of the first things I learned in my GIS classes was that there were only two real types of data. The first was vector data, which consists of individual points or polygons and might represent real world point objects like cities, store locations, houses, or area-based objects such as a state and county lines, flood-zones, or land parcels.
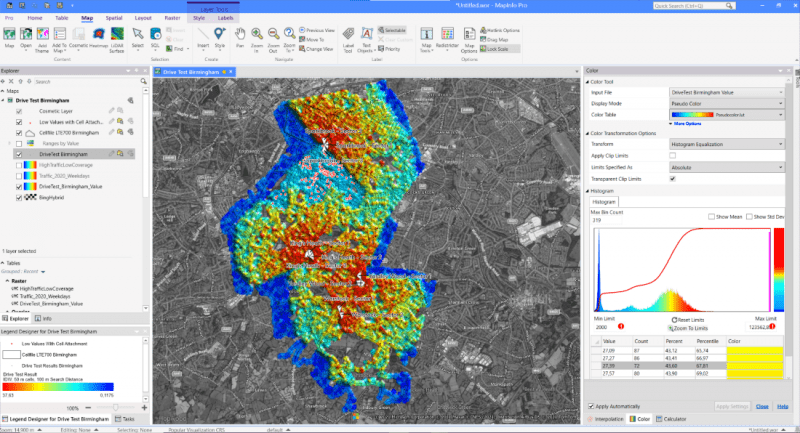
The second type was raster data, which is an image, or a grid of pixels, where each pixel has a unique value that represents a data point on the ground. Most people think of raster data as imagery that might come from a satellite, aerial plane, or drone. The information contained in each pixel can be extracted and the image can be used to derive many different types of maps including land cover classification, crop health, heat maps, and others.
MapInfo Pro 30-Day Free Trial
Unlock location insight with the complete desktop mapping solution
For more information on how Precisely can help you realize the potential of your GIS data, sign up today for a free trial of MapInfo Pro, our all-in-one GIS software that can help you realize the next level of GIS.
Visualization
While the concepts of vector and raster data remain, the truth is that there is an increasing number of different ways people share location-enabled data that goes beyond the creation of a map. The explosion of three-dimensional data types for supporting both raster and vector data has revolutionized the way people visualize and plan things like city skylines or 5G telco networks.
Leveraging location in business analytics
However many location intelligence analytics are never even viewed on a map. The adoption of dashboards for easily digesting data and analytics has changed the way that a GIS program needs to think about not only the analysis being done, but the way in which the user wants to consume the data. Combine this with the exponential growth in web-based data and analytics services, and you soon realize that the historical dichotomy between raster and vector data has been blurred.
System design
The foundation of a GIS is the data that it is based on. GIS came into popularity in the days of mainframe computers and desktop stations and the underlying data was contained in a series of databases that lived locally. The output was only as good as the data that went in, and it was up to the analyst to develop the relationships between the different datasets.
In today’s world, a system designed to access, analyze, and present location-based information can be designed using a variety of different models including on-premises, cloud-hosted, or as a hybrid model. On-premises means all of the data, software, and servers are all located on-site. This is the classic way of designing systems and is required by folks who have sensitive data that they do not want hosted outside of their walls. A cloud-based solution is one that takes advantage of software, data, analytics, and compute power as hosted services in the cloud.
A hybrid solution is one where portions of either the data, analytics, and compute power are on premises and portions are hosted online. Hybrid solutions are some of the most modern applications out there, as they often take advantage of modern technologies that allow analytics or data to be easily pushed between on-premises and cloud-based resources in a secure manner.
The GIS user vs. the user of GIS
The user of GIS data and software has historically been a single person or small department that was disconnected from the business intelligence function as a whole. A map would be requested, and the user would pull in the relevant data sources, manipulate them, and create a map visualization that would capture the needs of the request.
Nowadays location intelligence is part of the larger business intelligence function. The role of the GIS analyst is often that of a data curator, someone who finds and manages data sources that are relevant to many areas of the business and massages the data into the systems of choice for the end user. The GIS user is no longer the analyst, it is the downstream consumer of the GIS information who makes a subsequent business decision.
This desire for location intelligence to be fed downstream has increased the need for simple ways to access GIS output. Being able to translate map-based data into readable charts and data points increases the value of GIS data insights. This includes things like simplified interfaces for viewing data output, and integrations with reporting software packages that are popular in other areas of the company.
The ability for today’s GIS software to integrate easily with other technologies, whether they’re more advanced data and analytics services or simple ways to dashboard location-based information, is a key factor in realizing the value of location intelligence throughout the organization.
For more information on how Precisely can help you realize the potential of your GIS data, sign up today for a free trial of MapInfo Pro, our all-in-one GIS software that can help you realize the next level of GIS.