


Key Takeaways
- The same data can give opposite answers depending on how you draw the areas. Geographers call this the modifiable areal unit problem (MAUP), and Stan Openshaw showed it in 1979.
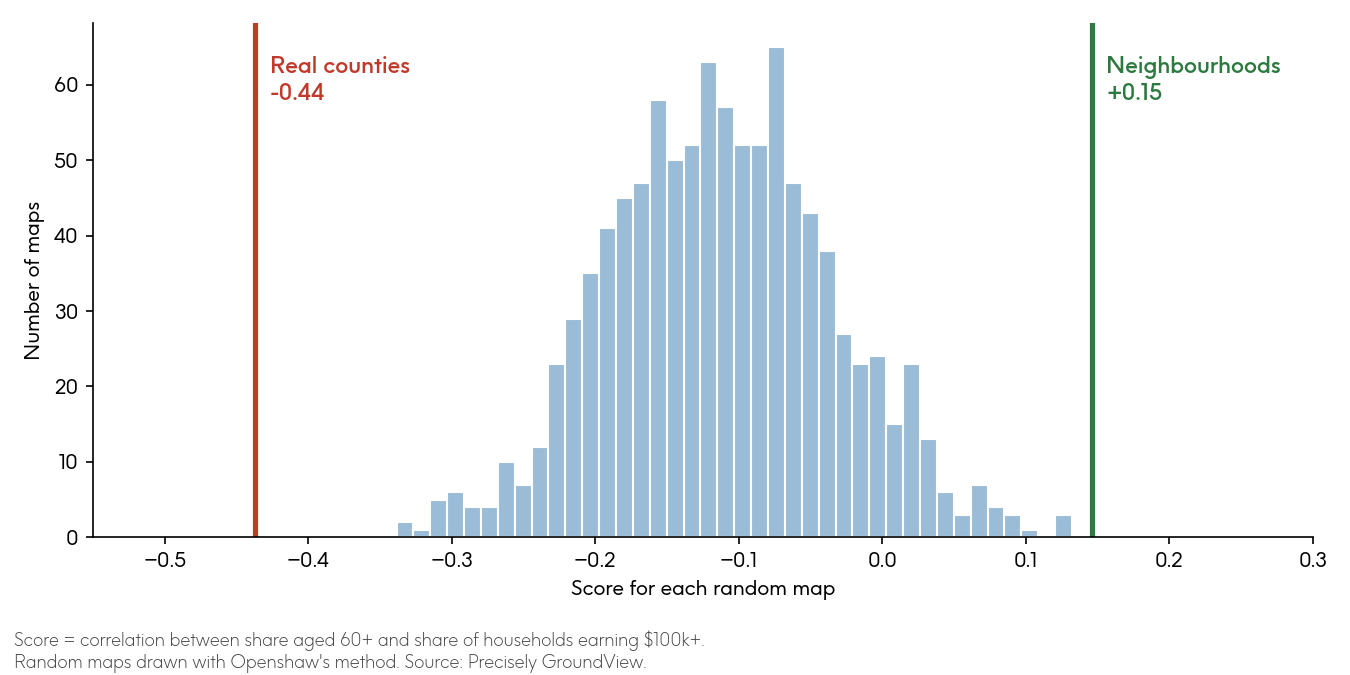
- It still holds today. In Iowa, a slight positive link between age and income in neighbourhoods becomes clearly negative once you add those neighbourhoods up into counties, and the real county boundaries give a more extreme answer than 1,000 random maps.
- With modern mapping and statistical tools, you can force almost any answer: the same Iowa data gave scores anywhere from -0.96 to +0.74. So start with the smallest areas you can, choose areas that fit the question, and check whether your answer holds across more than one geography.
Here’s a slightly uncomfortable fact about maps: you can take the same data, draw the lines differently, and get the opposite answer.
I was at the School of Geography at the University of Leeds while the late Stan Openshaw was teaching there, and this was one of his big ideas. He called it the modifiable areal unit problem, or MAUP.
Put simply, this means that whenever you add data up by area, such as ZIP codes, counties, or sales territories, the areas you choose shape the answer you get. It shows up in two ways: the size of the areas, and where the lines fall.
I thought I’d put it to the test with our own US demographic data, starting where Openshaw did.
What did Openshaw find in Iowa?
In 1979, he and Peter Taylor looked at Iowa’s 99 counties and the link between older residents and political voting habits. At the county level, the correlation was 0.34 (a score from -1 to +1, where 0 means no link).
Group those same counties into six regions and the score could land anywhere from 0.26 to 0.86, depending on how you grouped them. Later, using a computer to redraw the six regions deliberately, Openshaw could force the allocation of zones to get a score anywhere from -0.99 to +0.99.
The data never changed. Only the lines did. That’s what made the result so uncomfortable, and why it still matters every time someone makes a decision from a map.
What happens when you re-run the experiment today?
We went back to Iowa with our own data. This time we started with much smaller building blocks: Census block groups, which are neighbourhoods of a few hundred homes. Iowa has just over 2,700 of them. We used Openshaw’s age measure (the share of people aged 60 and over), set against the share of households earning over $100,000.
At the neighbourhood level, there’s a slight positive link (+0.15). Places with higher shares of older residents have slightly more high earners.
Now add those same neighbourhoods up into Iowa’s 99 counties. The answer flips to clearly negative (-0.44). Counties with higher shares of older residents have noticeably fewer high earners.
Same households, same question, opposite answer.
This doesn’t mean older Iowans earn less. Inside rural counties there’s barely any link at all. The negative comes from comparing older, mostly rural counties with younger, higher-income urban ones. Judging individuals from area-level data is the classic trap known as the ecological fallacy, and it’s easy to fall into.
Is it just where the county lines fall?
To find out, we used Openshaw’s own method to draw 1,000 random maps of Iowa, each grouping neighbouring block groups into 99 areas, similar to counties (Figure 2).
Most gave a mildly negative answer. None came out as negative as the real counties. The real county lines produce a more extreme answer than any of the random maps.
Finally, we used an algorithm to redraw the 99 areas to push the correlation scores up or down, with each area holding at least 10,000 people. The scores ranged from -0.96 to +0.74 (Figure 1).
Figure 1: Same Iowa neighbourhoods, four ways of drawing 99 areas

Figure 2: 1,000 random ways of drawing 99 areas in Iowa
Did we pick a good example?
Fair question. We picked these measures because they show the effect clearly. So we tried the same “redraw the lines” trick on 36 pairs of measures, drawn from nine demographic measures (age, income, household size, and so on). Every one of them could be made to look positive or negative just by moving the lines.
But not everything flips in practice. Education and income go together whether you look at neighbourhoods or counties. Strong links tend to survive the redraw. Weaker ones are much more at the mercy of the lines.
How should businesses deal with the modifiable areal unit problem?
Say you’re deciding where to market a premium product to older customers. Look at county data and older areas look like lower-income markets. Look at neighbourhoods and that’s not true at all. Pick the wrong level, and you’ll target the wrong places.
The same goes for:
- Sales territories: before blaming a rep for a weak territory, check the boundaries.
- Site selection: averaging a big trade area and a promising pocket of customers can hide a problem.
- Risk: a ZIP code can look low-risk overall while a few streets in it sit right on a floodplain.
Openshaw’s advice was simple: don’t just accept the areas you’re given. Pick them for the question you’re asking. Here’s how to put that into practice:
- Go as small as the data allows, and only add up to bigger areas when you need to.
- Use areas that fit the question. A drive-time area answers “who can reach my store?” far better than a county does.
- Try more than one geography. If the answer holds across several, you can trust it more. If it flips, that’s worth knowing too.
- Say which lines you used.
Map-based decisions that hold up
Openshaw showed it with 99 Iowa counties in 1979, and it still holds with 2,700 neighbourhoods today: the lines you draw can change the answer. Next time someone shows you a map with a clear winner, ask one question: would it still win if we drew the lines differently?
If you want to start from neighbourhood-level data and build up to the areas that fit your question, explore how trusted location data can help.
Frequently asked questions
What is the modifiable areal unit problem?
The modifiable areal unit problem (MAUP) is the way results from area-based data change depending on the areas used. The same data, added up into different areas, can show a stronger, weaker, or even opposite relationship. Geographers Stan Openshaw and Peter Taylor named and tested it in 1979.
What is the difference between the scale effect and the zoning effect?
The scale effect is the change you see when you use bigger or smaller areas, such as neighbourhoods vs counties. The zoning effect is the change you see when you keep the number of areas the same but draw the boundaries differently. Both can change the answer.
How is the modifiable areal unit problem related to the ecological fallacy?
The ecological fallacy is assuming that a pattern across areas applies to the individuals in them. The modifiable areal unit problem makes that trap more likely, because area-level patterns can differ from neighbourhood or individual patterns. In our Iowa example, older counties have fewer high earners, but that doesn’t mean older people earn less.
How can you reduce the impact of the modifiable areal unit problem?
Work with the smallest areas your data allows, and only combine them into bigger areas when you need to. Choose areas that fit the question, such as drive-time areas for store catchments. Test your results across more than one geography and say which boundaries you used.