eBook
The Ultimate Guide to IBM i Machine Data Analytics
Read this eBook to learn more about Ironstream and why it’s the industry’s most comprehensive automatic forwarder of IBM i machine and log data to analytics platforms.
What is IBM i log data?
IBM Power Systems running IBM i are trusted, reliable powerhouses tailored for the needs of companies that process a high volume of transactions, such as financial, healthcare, retail, and logistics organizations. Over its lifespan, the IBM i has been known as the iSeries, AS/400, System/38 and more – names you still hear from long-time users of the platform. There are several different data sources that are available within the IBM i environment that can be leveraged to provide insight into the operational health of the system and applications, as well as providing visibility into security and compliance issues. Most of these come in the form of journals, data base files, or message logs recorded by components of the IBM i OS. They provide information about security, operational issues, system resource utilization (CPU, Storage, I/O), and performance.
The data sources provide valuable insight into performance, availability, health, and security of the system and its applications. Organizations understand and see the value of incorporating IBM i machine data into their analytics processes. With all the data sources and volume of data available on the IBM i platform, each use case becomes an exercise in identifying the right set of information needed to meet the needs of the organization. Let’s look at the different data sources and how they can be used for two primary use cases: IT Operational Analytics (ITOA) and to address Security and Information Event Management SIEM challenges.

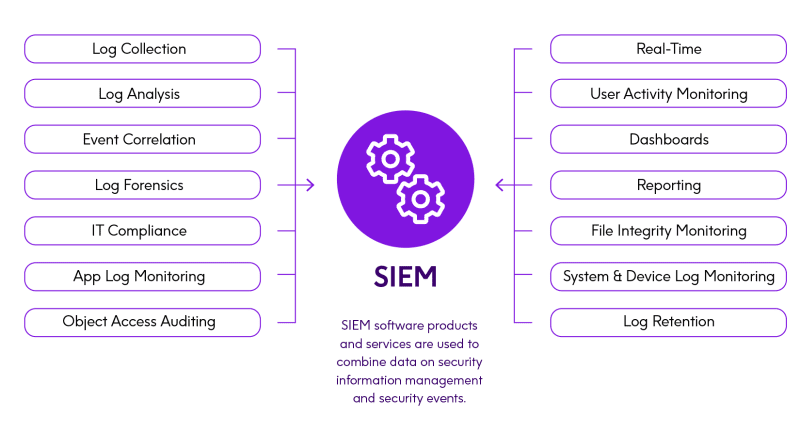
Security and Information Event Management (SIEM)

SIEM technology aggregates and provides real-time analysis of security alerts using event data produced by security devices, network infrastructure components, systems and applications. A primary function of SIEM is to analyze security event data in real-time for internal and external threat detection to prevent potential hacks and data theft. This typically includes user behavior analytics (UBA) – understanding user behavior and how it might impact security. SIEM technologies also collect, store, analyze, and report on data needed for regulatory compliance to ensure that audit requirements are met as dictated.
Understanding potential security threats and preventing security breaches has become paramount to just about every IT organization. The image and financial damage caused by a security breach can cripple an organization. Compliance initiatives further increase the burden put on most organizations to get a better handle on security.
The IBM i operating system can produce an abundant amount of information related to security. Typically, every security event – application logons, object accesses, and more may be recorded in some form. The problem is the volume of security information and how to make sense of it. Events related to potential security breaches, including logon failures or unauthorized object access attempts, must be continuously monitored and analyzed to understand threats and breaches. Inevitably there will be inadvertent attempts to access an object by an unauthorized user, or a logon failure due to an incorrect password being entered – but separating this “noise” from real threats requires deeper analysis of patterns over time.
Forwarding IBM i security events into an analytics platform enables in-depth analysis of access patterns, authorization failures, user behavior, and other security-related information to detect potential security threats and prevent breaches.

IT Operational Analytics (ITOA)
According to Gartner Group, IT Operational Analytics (ITOA) is a market for solutions that bring advanced analytical techniques to IT operations management use cases and data. ITOA solutions collect, store, analyze, and visualize IT operations data from other applications and IT operations management (ITOM) tools, enabling IT operations teams to perform faster root cause analysis, triage, and problem resolution.
The IT infrastructure of most large organizations is comprised of different systems and platforms each with unique toolsets requiring domain specific skills to extract and leverage value from those tools. Forwarding IBM i machine data and logs into an analytics platform opens a variety of opportunities to enhance IT operational intelligence and gain better organizational efficiency, without having to rely solely on platform specific tools. For example, the following ITOA use cases can be supported:
- Monitoring job activity
- Monitoring physical and virtual processor utilization
- Monitoring network activity
- Monitoring database performance
- Monitoring memory and disk utilization
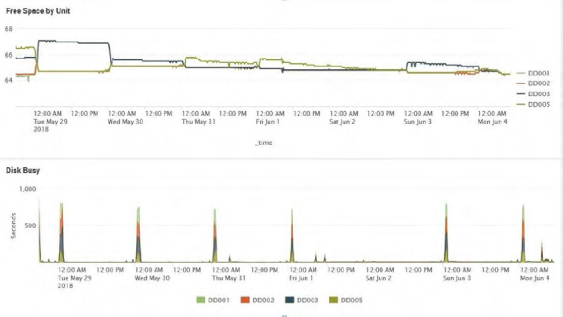
Example of IT Operational Analytics for disk space utilization and performance.
IBM i data sources
These are the primary sources of information logged on IBM i:
System audit journal
This contains a variety of information focused on supporting security information and event management. Security events include things such as changes to system values, object authorities, profiles, authorization lists, access attempts, power user activity, transfers of objects to production libraries, actions on spooled files, adopted authorities, exit points, access of sensitive objects, and more. Essentially anything that is happening within the system environment that might impact security is contained within the System Audit Journal.
Operator messages – QSYSOPR message queue
QSYSOPR messages may be used to indicate an action required by an operator or simply to provide the system operator notification of changes to the environment. Messages alerting the operator to a condition that needs attention may include loading a next tape volume, servicing a printer, saving a version of QHST, replying to a message to cancel a job, or allowing a job to exceed its spooled printer output limit. Operator notifications, for example, include messages such as jobs being held or released by a user.


System and application messages – QSYSMSG message queue
This optional queue contains messages primarily related to end user connections that are failing along with the reason for the failed connection.
The system sends certain messages to QSYSMSG, to QSYSOPR, or to both QSYSMSG and QSYSOPR, depending on the system reference code (SRC) sent with the message and whether the SRC is being logged with critical message handling.
Accounting journal
This contains information related to job and printer activity. There is an entry for each job completion/termination which contains details related to the job’s execution, including resource usage such as processor time. Information about printer and spool activity is also recorded in the accounting journal.
QHST history log
The history (QHST) log consists of a message queue and a physical file known as a log-version. Messages sent to the log message queue are written by the system to the current log-version physical file. QHST contains a high-level trace of system activities such as system, subsystem, job information, device status, and system operator messages. Records stored here can be complex in nature and require some reformatting for usability in reporting.
Collection services and logs for performance data
The IBM i platform can be configured to collect an abundant amount of performance information. When performance data collection services are in effect, the IBM i operating systems logs relevant performance metrics to a Management Collection object. The metrics are extracted from the object and stored into Db2 tables either in real time or at a later point. These Db2 tables may optionally be journaled as well. Performance information can be extracted from either the Db2 tables or the journals and analyzed to understand the performance of the operating systems, system components, and executing applications.

IBM i data elements for analytics
Listed below is a sample of the data elements that can be captured from IBM i machine data and logs. With this information available for analytics, organizations can address many ITOA and SIEM use cases.
Security information
- User profiles
- System values
- Object attributes and authorities
- Authorization lists
- Job descriptions
- Commands
- Active jobs
- Spool files
- Changes to values, authorities, profiles, authorization lists
- Access attempts for authentication or object access
- Sensitive object access
Job information
- CPU used Disk I/O detail
- Page faults
- I/O pending faults
- Socket sends/receives
- Stream file, directory and Symlink reads
- Stream file writes
- Seize/wait time
- Communication puts/gets
Physical processor information
- Time used
- Owning partition
CPU information per virtual CPU
- Time used
- Number of CPUs active
Virtual processor information
- Status, time active, time used
- Configured/Uncapped available time
- Instruction count
Memory pool information
- Database & non-database faults
- Job transitions size
- Disk I/O stats
- Pages aged and stolen
Disk information
- Reads/writes
- Disk capacity and space availability
- Disk busy
- Disk response times
TCP communications
- Detailed stats at the datagram level
- Network fragmentation information
Gain valuable insight from IBM i log data
Analytics platforms make it simple to collect, analyze, and act upon the untapped value of the big data generated by technology infrastructures, security systems, and business applications – providing the insights to drive operational performance and business results. They typically collect and index log and machine data from any source and provide powerful search, analysis, and visualization capabilities to empower users of all types. The problem is that most of these analytics platforms have no good connectors or mechanisms to get to machine data produced on IBM i platforms.
Precisely Ironstream is the industry’s most comprehensive solution for automatic forwarding of machine and log data to analytics platforms. In the past, the IT shops needed significant expertise and resources to extract data from the different data sources on an IBM i system. With Precisely’s log forwarding solutions, it is easy to feed data to Splunk and other analytics platforms for visibility into activity on all systems — including the IBM i — from one integrated user interface.
Information from key IBM i data sources, logs and message queues can be normalized and forwarded to analytics platforms.
This enables analytics systems to provide total visibility into the IBM i environment and the applications it supports. There is no need for special knowledge and expertise to correlate IBM i data with that coming from other platforms. The automatic collection and forwarding of information from IBM i data sources demystifies the complexity of those data sources and enables your organization to easily gain operational and security insights into the IBM i environment and address operational and security issues across your entire IT infrastructure.